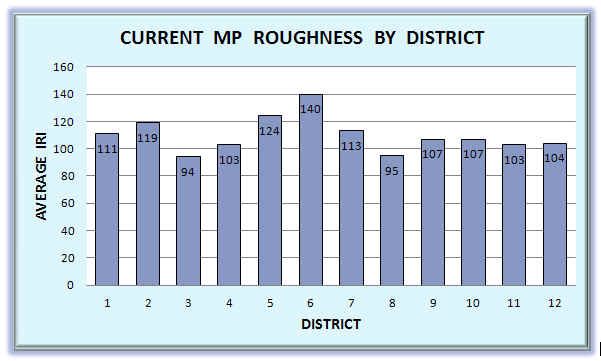
Shown here are the most recent average roughness values for each district as
measured by the International Roughness Index (IRI). IRI values increase as
roughness levels increase. These average values are weighted according to
vehicle miles traveled on each pavement section. Consequently, they represent
the ride quality that the average driver could expect within each district.

