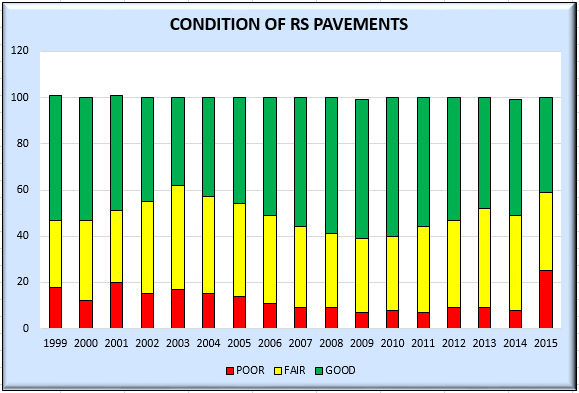
The data below shows the breakdown of Good, Fair, and Poor condition RS
pavements since 1988. These values are determined by a combination of IRI and
Traffic Volumes. The percentage of poor RS pavements has been steadily
decreasing since 2003 and is now at its lowest recorded level (9%). This means
that 91% of all RD pavements are in Good or Fair condition.
YEAR
MILES IRI
AGE
ADT
GOOD FAIR POOR 1988
12,152 136 *** 610
49% 35% 17%
1989 12,153
139 *** 610 47%
32% 21%
1990 12,153 137 ***
650 51% 30%
19%
1991 12,152
134 *** 670 56%
29% 15%
1992 12,152 131 ***
690 59% 28%
14%
1993 12,153
130 *** 710 60%
27% 13%
1994 12,153 129 ***
730 61% 28%
11%
1995 12,153
126 *** 750 61%
26% 13%
1996 12,153 121 ***
770 67% 22%
11%
1997 12,153
120 *** 770 68%
19% 14%
1998 12,153 136 11.0
790 56% 31% 12%
1999 12,156
136 10.4 800 54%
29% 18%
2000 12,166 137 10.1
820 53% 35%
12%
2001 12,163
136 9.5 810 50%
31% 20%
2002 12,132 135 9.2
790 45% 40%
15%
2003 12,134
135 9.4 780 38%
45% 17%
2004 12,994 133 9.7
706 43% 42%
15%
2005 12,965
132 9.8 718 46%
40% 14%
2006 12,982 129 9.6
739 51% 38%
11%
2007 12,826
130 9.7 734 56%
35% 9%
2008 12,800 129 10.6
734 59% 32%
9%
2009 12,833
129 10.5 730 60%
32% 7%
2010 12,833 128 11.4
731 60% 32%
8%
2011 12,678
131 12.3 718 56%
37% 7%
2012 12,763 --- 13.2
644 53% 38%
9%
2013 ----
--- *** -----
48% 38% 9%
2014 12,742 --- ***
----- 51% 41%
8%
2015 12,742
--- *** ----- 51%
41% 8%